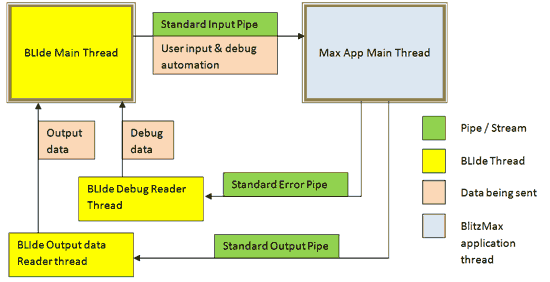
I’ve been spending most of the week redesigning the current communications schema between BLIde and any BlitzMax application being debugged, and next BLIde version will be using the following schema:

In this new schema, BLIde uses 3 threads at the same time while an application is being debugged. This way, BLIde keeps its main thread for user interaction and responsiveness, and also adds a secondary thread to deal with all data being collected from the Standard Error Pipe of the application being debugged.
This Debug Reader thread, collects all information being thrown by the internal debugging process of the debugged application and brings this information back to the main thread, in order to display this information to the user. This internal data exchange is done using synchronized event invocation, so everything is paralleled properly. The important thing on this new design is that, if the Standard Error pipe gets overloaded because a missing flush on the debugged program, or because the debugged program crashed, BLIde will still be 100% responsive and will be able to track this issue and eventually kill the debugged application process in a clean way, releasing any associated resource.
In addition to the Debug Reader Thread, there is also a Output Data Reader Thread. This thread gets ride of the standard output stream of any BlitzMax application. Any data added to the default output (as instance, any Print command) will be captured by this thread. This thread will perform also all the needed Unicode Conversions and, only when all the data is ready to be displayed on the BLIde console, this data will be passed to the BLIde Main Thread, to be shown to the BLIde user. This separate thread ensures that any data added to this pipe is not causing parsing errors on the standard error pipe and also, any synchronized operation will not make any other read/write/interact operation to be stopped.
The BLIde Main Thread will also send any debug request (such as stack-traces, object dumbs, etc.) to the BlitzMax application being debugged. This main thread implements a internal queue system to keep object dumb request in parallel to object dumb responses being reported by the Debug Reader Thread.
OK, but what are the advantages of this new design?
First of all, tones of them. To name two that are, from my point of view, the most interesting ones:
1.- BLIde responsivenes while debugging is drastically improved at a zero cpu cost, compared with previous debugging design, even on core-solo computers (as long as they have hiper-threading technology).
2.- If you’re debugging a server application and an unhandled exception occurs. You’ll be able to get a compete call stack and exception information even if the application has been closed by BLIde. This is very important becouse server-like application are not always monitorized while running. BLIde will also show the exact line of code where the exception did happen.
3.- If an application being debugged full screen raises an unahandled exception, BLIde will still be responsive even if not shown by the OS (because of the graphics context hiding anything else). In that case, users will be able to press Ctrl+F8 and BLIde will kill the debugged application but informing on what was the exception, when and where did it happen, a complete call stack and a basic object dumb information on the general program status.